
How to Build and Compare Multiple Trading Strategies Without Coding
Aug 22 | 7 Mins MIN | Kvants Studio

By
Kvants Team


How to Build and Compare Multiple Trading Strategies Without Coding
Most trading ideas are not isolated. A trend-following rule may work in one market regime, while a mean-reversion rule behaves differently. A breakout strategy may be attractive on one asset and fragile on another. Comparing several hypotheses can reveal which assumptions are doing the real work.
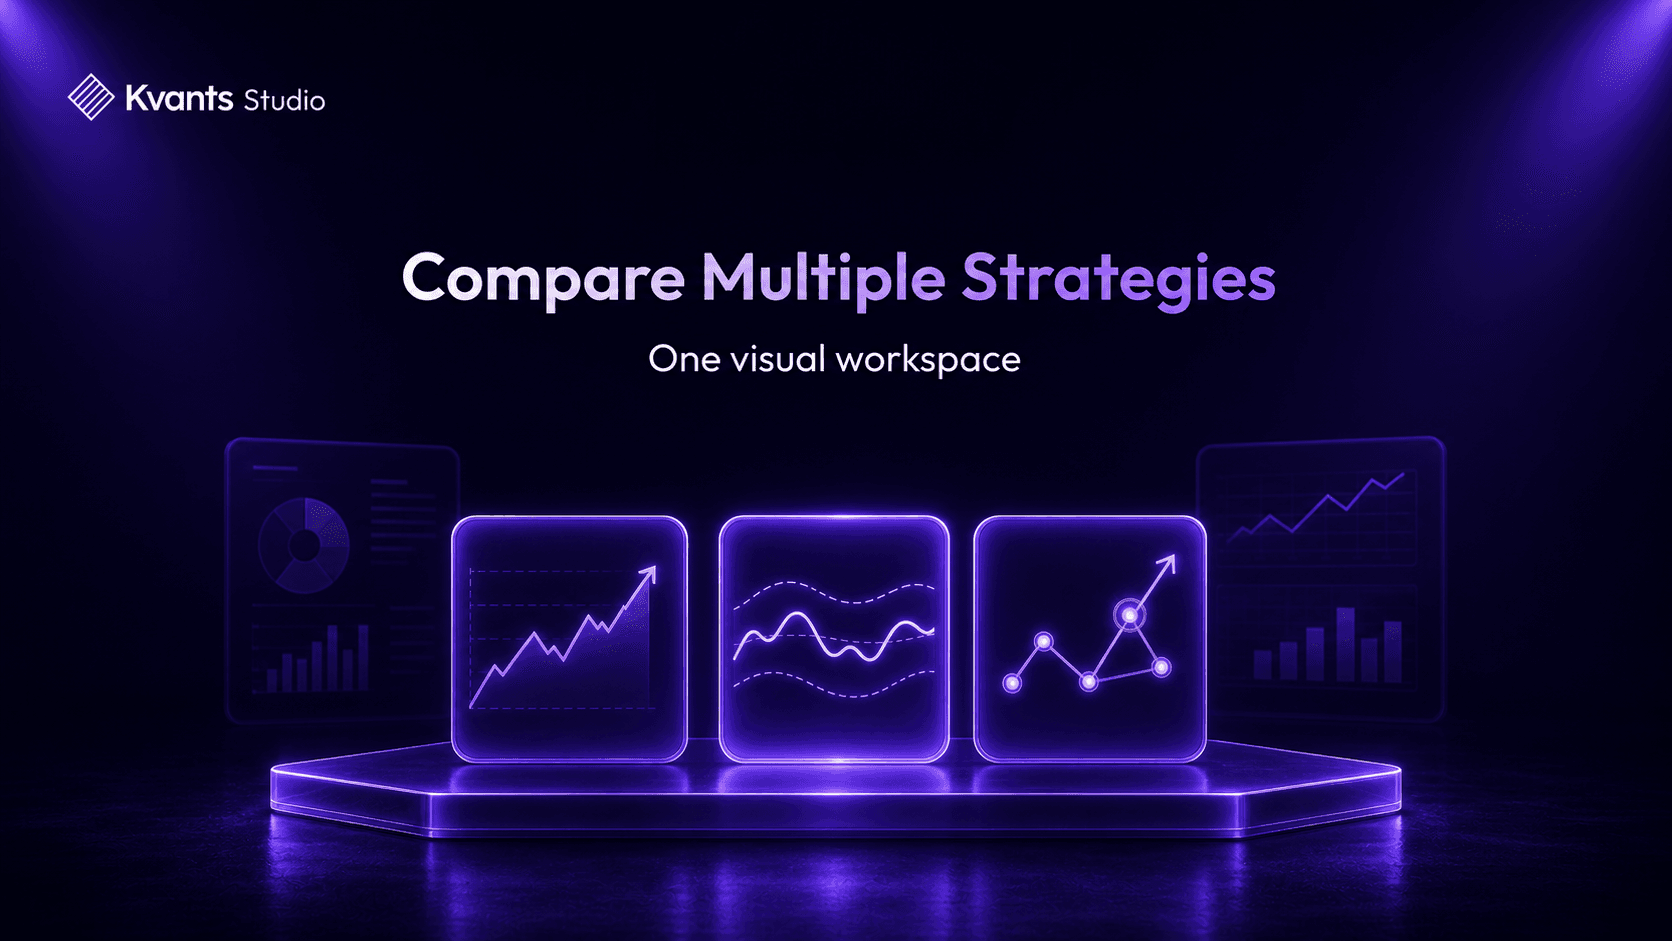
Kvants Studio lets you build, inspect, and compare strategies in one visual workspace without writing code. You describe each idea in plain English, AI drafts an editable strategy graph, and you test the alternatives under consistent conditions.
Start with distinct hypotheses
A useful comparison begins with strategies that have a clear reason to exist. For example:
A trend strategy that follows persistent directional moves.
A mean-reversion strategy that looks for temporary deviations from a reference price.
A breakout strategy that reacts when price leaves a recent range.
A defensive variant that reduces exposure when volatility rises.
Kvants Studio can translate each description into nodes for market data, indicators, signals, entries, exits, sizing, and risk. You can inspect the generated logic and revise it in plain English or directly in the graph.
Keep the comparison fair
If every strategy uses different data, fees, position sizing, and date ranges, the comparison may say more about the assumptions than the ideas. Use a common test framework where possible.
That means aligning the asset universe, bar frequency, historical period, transaction-cost assumptions, and capital allocation. Define whether strategies can hold positions at the same time and how overlapping exposure should be handled.
A fair setup makes the differences easier to interpret.
Look beyond total return
The best-looking equity curve is not automatically the strongest strategy. Review drawdown depth and duration, trade count, turnover, exposure, risk-adjusted metrics, and the concentration of gains and losses.
Also ask how each strategy behaves during different environments. Does the trend model struggle in sideways markets? Does the mean-reversion model suffer during sharp repricing? Does a breakout rule depend on a narrow set of assets or dates?
Kvants Studio helps you inspect the trade-level evidence and compare strategy results without hiding the underlying rules.
Test robustness, not perfection
A strategy should not collapse when a lookback changes slightly or costs become less favorable. Run sensitivity tests and preserve an out-of-sample period. If one precise parameter combination is responsible for all of the apparent edge, that is a warning sign.
You can ask Kvants Studio to create controlled variants in plain English, such as:
“Compare this 20-day breakout with 30-day and 50-day versions.”
“Add the same volatility-based position sizing to all three strategies.”
“Test each strategy separately across bullish, bearish, and high-volatility periods.”
Because every change remains visible in the graph, you can verify that the comparison matches your intent.
Understand combined exposure
Multiple strategies can diversify their behavior, but they can also make the same bet in different forms. Two models may use different signals while both becoming heavily long during the same market move.
Before combining strategies, examine correlation between returns, simultaneous drawdowns, asset overlap, and total exposure. Set portfolio-level limits as explicitly as strategy-level stops or sizing rules.
This is research and risk analysis—not a promise that combining strategies will improve future performance.
Move from research to paper testing
When a group of strategies looks credible in historical testing, paper trading can expose practical differences in data timing, order frequency, slippage, and operational complexity. Compare what the strategies actually do in the same live environment before considering real capital.
Where supported, Kvants Studio can export strategy artifacts such as Pine Script or a Kvants strategy file. That makes it easier to review, share, or continue working outside the visual builder.
A workspace for strategy research
Kvants Studio is an AI trading strategy builder for stocks and crypto. It is not an investment product that allocates money across managed strategies, and it is not a promise of passive returns. You create the hypotheses, inspect the rules, choose the tests, and decide what happens next.
Start with two genuinely different ideas, give them the same test conditions, and compare the evidence. Plain English lowers the cost of building variants; transparent graphs help keep the research accountable.
Backtests and simulations are hypothetical and do not guarantee future results. Kvants Studio provides strategy-building and research tools, not personalized investment advice.

Read more